Paving the Path to Sales
- paul18053
- Sep 7, 2025
- 2 min read
Updated: Sep 9, 2025
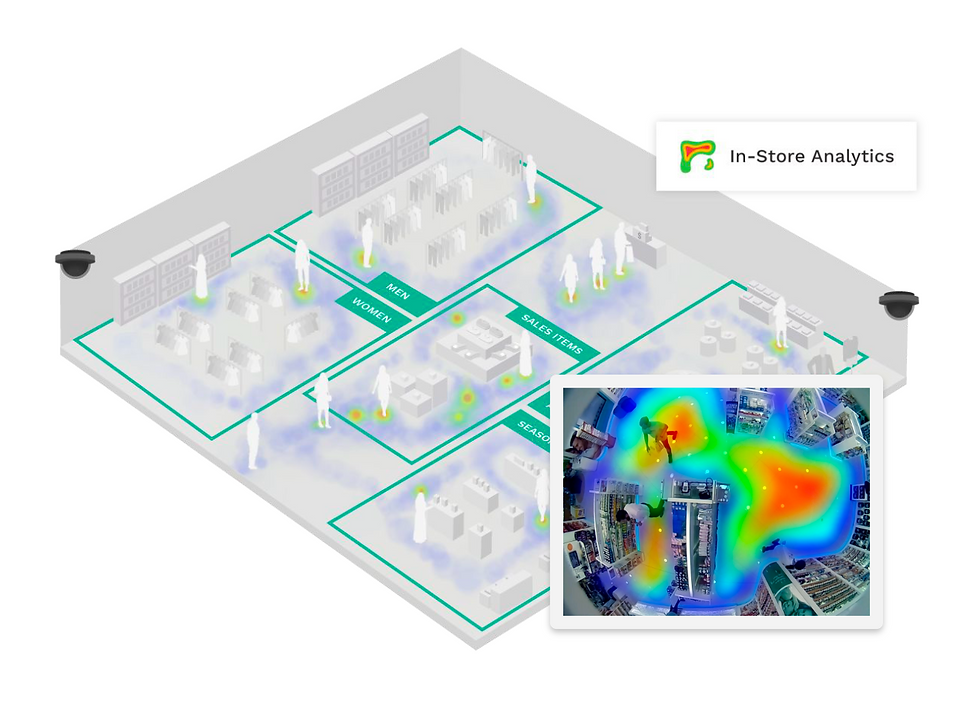
FootfallCam Heatmap & Customer Engagement
Seeing Beyond Footsteps: Why Paths Reveal Profits
Every step in a store is a signal. With FootfallCam Centroid™ AI analytics and 3D ProWave™ mmWave sensors, retailers map customer journeys, dwell zones, and product engagement. Staff exclusion and privacy safeguards ensure clean heatmaps—turning movement into insights for layout design, merchandising, and marketing ROI

Why Heatmaps Are a Business Decisions
Where customers walk or don’t, reveals store performance. Without data, poor layouts go unnoticed, campaigns fail silently, and hot/cold zones stay hidden. IoT heatmaps transform movement into measurable engagement, helping managers redesign layouts, boost campaign impact, and optimize shelf placement.
Reading the Story Written on Your Store Floor
Engagement Metric | Target Range | What Happens When You Miss | IoT Sensor Pay-off |
Zone Traffic Balance | Even across zones | Bottlenecks & underused areas | Smarter layout, better flow |
Average Dwell Time | Stable by area type | Missed upsell or poor campaign ROI | Identify hot spots & cold zones |
Engaged Visitors | ≥ 20–30% in promo areas | Low campaign effectiveness | Adjust signage, promotions dynamically |
Passer-by Rate | Minimized in target areas | Poor display design | Reconfigure product positioning |
Centroid™ leverages CCTV feeds; ProWave™ mmWave provides wide coverage (120° FOV) with no cameras, ensuring full privacy.
From Traffic Trails to Sales Tales
Centroid™ AI Analytics – Tracks skeleton movement across zones.
3D ProWave™ – Detects fine movements with total privacy (no images).
Operational Dashboards – Heatmaps, dwell times, Sankey path diagrams.
System Integrations – Feeds planogram optimization and campaign ROI tools.
Predictive Analytics – Identifies high-engagement products and underperforming displays
Cloth store Case Study
Context: A multi-floor retailer needed to measure ROI of promotional islands vs. standard racks. Manual observations missed subtle differences in dwell and engagement.
What We Deploy:
ProWave™ mmWave sensors for wide-zone coverage.
Centroid™ AI reusing existing CCTV.
FootfallCam V9™ heatmap & campaign effectiveness reports.
Integrations into merchandising dashboards for real-time reallocation.
Operational Playbooks Enabled
Campaign ROI Tracking – Compare dwell rates before/after campaigns.
Planogram Optimization – Identify dead zones and reposition displays.
Staff Deployment – Move staff to high-engagement areas for upsell.
90-Day Results
+18% campaign ROI evidence using dwell data.
–22% underutilized floor space converted into revenue zones.
+11% upselling conversions with targeted staff presence.
From Pilot to Portfolio—Four-Step Rollout
Pilot – Map 1–2 zones with CCTV + ProWave sensors.
Integrate – Connect heatmaps into campaign ROI tools.
Scale – Extend to full store floors.
Optimize – Continuous floorplan A/B testing.
Compliance & Assurance Built-In
Privacy is preserved: ProWave™ captures non-visual mmWave data, and Centroid™ anonymizes skeleton tracking. No personal identities are stored
Key Takeaways
Movement = engagement. Heatmaps show sales opportunities.
FootfallCam converts paths into insights for layouts, campaigns, and merchandising.
Start with campaign zones, scale across entire floors.


Comments